A Quantitative Macro View
Our Macroeconomic model is structured to quantitatively determine the climate for risk assets across different regions in the world. It further underlines the economic health of each country or area in relation to each other and in relation to itself. The model is actively employed in our strategic asset allocation decisions and is built on 3 legs which are: Cost of money, purchasing power and productivity. We use various quantitative measures under each leg to properly account for the country or region’s position in relation to its own history and that of other countries and regions. These observations are ranked per leg and per country and each country and region is ranked based on all three legs in relation to each other. A low rank means the country or region is more competitive and likely more supportive for risk assets than a country with a higher rank.
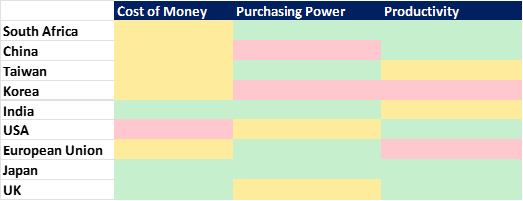
The above heatmap illustrates that the increase in interest rates (cost of money) happened at different frequencies across the above-mentioned economies. South Africa for example was early to start its hiking cycle and the same can be said about the US which is red on the map since its rates is significantly higher in relation to its historic levels. It is however important to note South Africa’s purchasing power (inflation) is still at acceptable levels when compared to its historic inflation levels, yet the SARB decided to act early with higher interest rates. This step was explained by the SARB governor as a way of protecting the ZAR against the USD as mentioned above. The Federal Reserve Bank however seem to have good reason to act as aggressively as they do currently, based on US inflation registering levels last seen in the 1970’s. The last leg of the above table is concerned about productivity per region. South Africa is scoring higher than its historic average as shown on the heatmap which has a lot to do with the higher production in the mining industry in the past 18 months. The European Union is under pressure from a production point of view and given the current challenges with energy, this area is expected to underperform in the near term.
Our process involves ranking different regions to steer us in the tactical asset allocation process in our portfolios. The ranks are based on the three legs mentioned above and the process seeks to answer the question which regions are the most suited for investment in risk assets (Equities) based on the observations above. The rankings might surprise readers and the reason for that is that the logic employed to arrive at the outcomes are ultimately forward looking and not reactive in nature. This characteristic tends to be positive about a region when its actual readings are at its worse and vice versa.
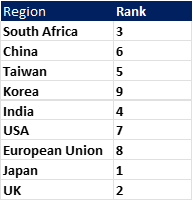
South Africa ranks favourably in relation to other emerging countries according to our models, and it is clear from the above that the prominent economies in the world are still under severe pressure now.
Given the current position of each area we also attempt to find similar periods in the past where our model gave similar results, in an attempt to learn about the potential path going forward.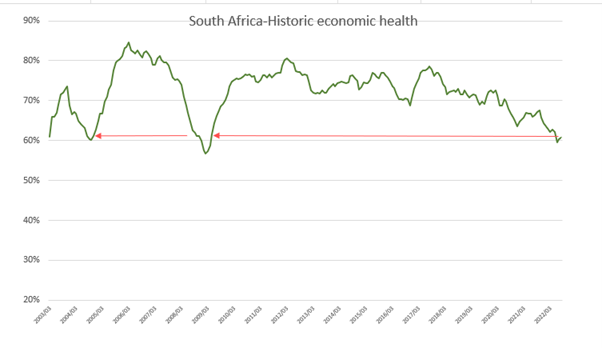
The above chart illustrates South Africa’s economic health since 2003. The current position is compared to two periods in the past that delivered similar readings as the current environment. The periods are November 2004 and May of 2009. Both these periods saw positive returns in the 6 months after the reading
.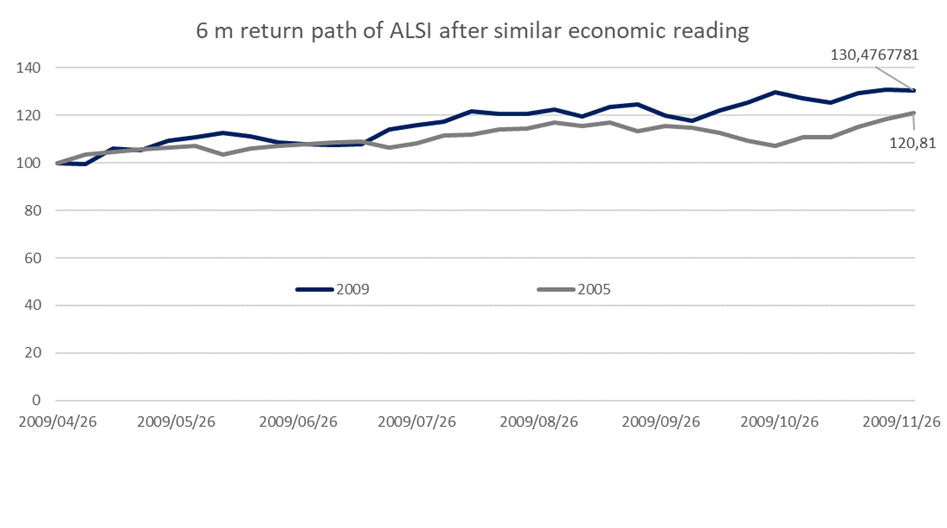
The above chart paints the 6-month path that SA Equities followed, after registering similar readings than the current reading. These two outcomes were overwhelmingly positive for SA Equities. This is purely an observation and might or might not manifest, but it gives one perspective of similar periods in the past and is a reminder that when markets recover such a recovery starts when sentiment is at is most negative.